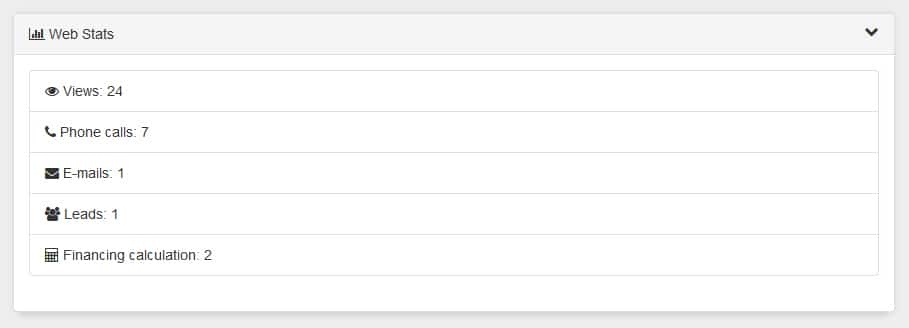
Votre site web AutoPro.io suit désormais les interactions de chaque utilisateur, sur chaque véhicule et vous les affiche directement dans votre logiciel de gestion de concessionnaire automobile.
Le logiciel suit actuellement 5 interactions unique des utilisateurs pour chaque véhicule affiché sur le site web de votre concessionnaire automobile.
Chaque fois qu’un utilisateur effectue l’une de ces actions, l’action est automatiquement enregistrée avec la date et l’heure dans le journal des actions.
Les 5 actions actuellement suivies sont:
Visites
Appels téléphonique
Courriel
Envoi de message
Calcul du financement
Page Views
Every time a user visits the details page of a vehicle in your inventory, it is recorded to the action log along with the date and time that the user viewed the page.
Phone Calls
If a user clicks the « Call Now » button, that action is recorded to the action log along with the date and time. Due to multiple factors including connectivity and signal issues, a click on this button does not necessarily mean the call was successfully completed.
E-mails
If a user clicks the « Send E-Mail » button, that action is recorded to the action log along with the date and time. Due to multiple factors including connectivity and signal issues, a click on this button does not necessarily mean the e-mail was successfully completed or sent.
Message Sent (New Lead)
Upon clicking the « Send Message » button a lead is created in your DMS for this vehicle and this action is recorded. This action process happens entirely on the AutoPro platform, therefore this statistic is definitive and should match with the number of inbound website leads for this vehicle.
Financing Calculator
If a user submits a request through the financing calculator, this action is recorded in the action log.
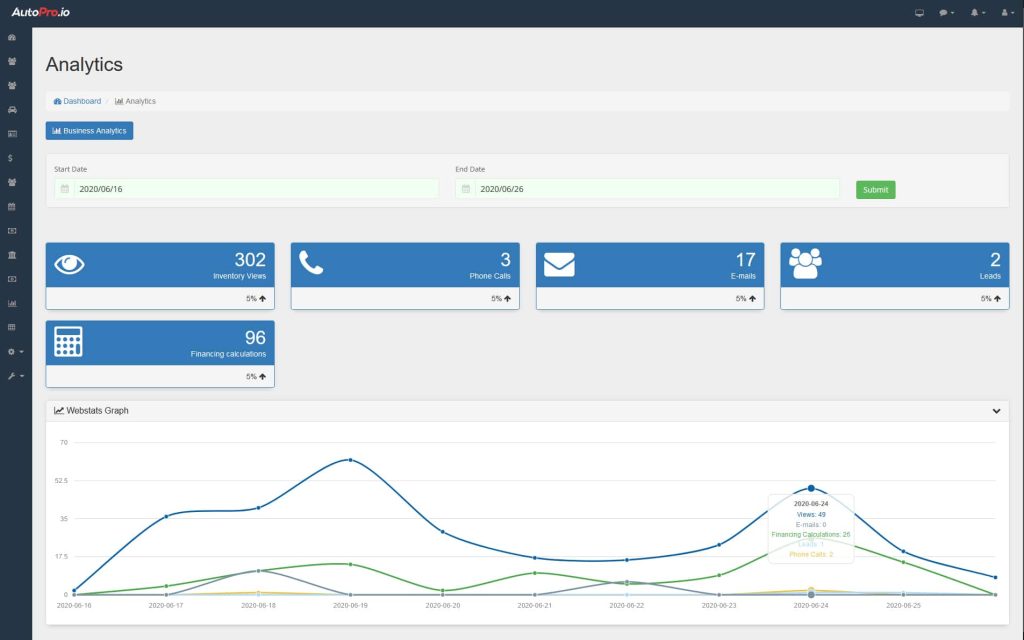
Advanced Web Statistics Reporting
Your AutoPro.io dealership management software alows you to access even more advanced statistics by going to the Analytics module, and then clicking the web stats button.
In this view, you can select a date range to get web stats for that particular period.
The software will use the data to generate a visual depiction of your data in the form of a line chart.


